
Knowing your diabetes numbers helps you interpret readings, plan next steps, and discuss care with your clinician. This guide explains target ranges, testing methods, and practical actions for highs and lows.
Key Takeaways
- Know core targets: fasting, post-meal, and A1C.
- Use charts to interpret results and trends.
- Act promptly on dangerous highs and lows.
- Pair numbers with symptoms and context.
Understanding Diabetes Numbers in Context
Glucose values change with meals, activity, stress, and illness. Clinicians often reference fasting plasma glucose (FPG), postprandial glucose, and hemoglobin A1C (average three-month level). Targets can differ for age, comorbid conditions, pregnancy, or risk of hypoglycemia (low sugar). Interpreting a single reading without context can mislead.
For many nonpregnant adults, professional bodies suggest premeal targets around 80–130 mg/dL and less than 180 mg/dL one to two hours after starting a meal. These are general ranges and may be individualized. For formal guidance, see the American Diabetes Association standards, which outline glycemic goals and when to adjust therapy in the annual standards of care. Use these targets to frame conversations with your care team, not to self-adjust medication.
Glycemic Targets: Fasting, Post-Meal, and Random
Morning readings before eating reflect overnight control and liver output. A typical goal for many adults is a normal fasting blood sugar level near 80–130 mg/dL, but your clinician may individualize. After meals, glucose naturally rises, peaking around 60–120 minutes. Measuring one to two hours after the first bite shows how food and medication interact.
Random testing captures a value at any time of day. It can help during illness, travel, or unusual schedules when fasting or timed checks are hard. Pair random readings with notes on food, activity, and symptoms. This context turns a single number into meaningful information. For practical education tools that support daily checks, see National Diabetes Education Week Tools for ideas you can adapt at home.
Common Testing Methods
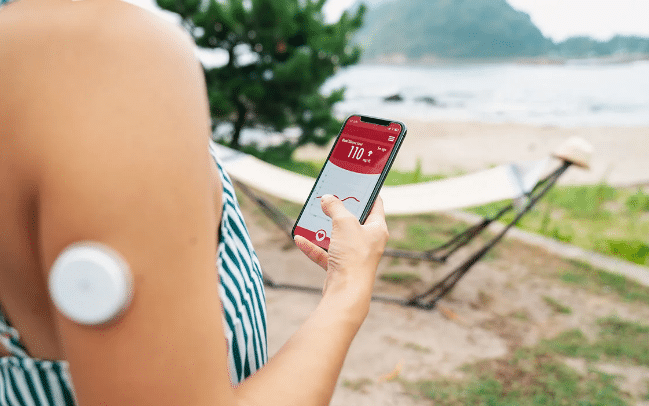
Clinicians use several tests to assess glycemia (blood sugar level). Fasting plasma glucose measures glucose after at least eight hours without food. The oral glucose tolerance test (OGTT) measures response to a glucose drink over two to three hours, useful in certain diagnostic settings. A1C (glycated hemoglobin) estimates a three-month average and is not affected by short-term changes. Self-monitoring with a meter or continuous glucose monitor (CGM) offers day-to-day insights. Each method answers a different question, so results should be interpreted together.
Visual Guides: Charts You Can Use
A normal blood sugar levels chart helps you map your meter readings to recognized targets. Use it as a reference, then personalize it with your clinician’s advice. Consider adding notes about meal timing and medications alongside readings for a clearer picture of patterns.
| Timing | Typical Target (mg/dL) | Typical Target (mmol/L) |
|---|---|---|
| Fasting / Premeal | 80–130 | 4.4–7.2 |
| 1–2 Hours After Meal | < 180 | < 10.0 |
| Bedtime (individualized) | 90–150 | 5.0–8.3 |
Targets may be looser for older adults, those with frequent lows, or complex conditions. If you need reliable supplies for home testing, review Freestyle Lite Test Strips to maintain consistent measurement quality, and see Diabetes Products for additional meters and accessories.
A1C and Estimated Average Glucose
Your A1C reflects the percentage of hemoglobin with attached glucose. It approximates an average over about three months, then converts to estimated average glucose (eAG). This helps compare lab results to your daily meter values and can reveal trends you might miss with spot checks. The NIDDK explains A1C and eAG and how labs measure them.
Use the a1c average blood sugar chart below to translate results:
| A1C (%) | eAG (mg/dL) | eAG (mmol/L) |
|---|---|---|
| 6.0 | 126 | 7.0 |
| 7.0 | 154 | 8.6 |
| 8.0 | 183 | 10.2 |
| 9.0 | 212 | 11.8 |
| 10.0 | 240 | 13.3 |
Note: Certain conditions (e.g., anemia, kidney disease) can distort A1C. If A1C and meter data conflict, ask about alternative markers like fructosamine or rely more on structured self-monitoring.
When Is High Or Low Dangerous
Know the symptoms and thresholds for action. Many clinicians define Level 1 hypoglycemia as less than 70 mg/dL, Level 2 as less than 54 mg/dL, and Level 3 as severe with altered mental status regardless of number. Hyperglycemia becomes urgent if sustained above 250–300 mg/dL with illness, vomiting, or ketone presence. For definitions and risk guidance, the ADA describes hypoglycemia levels and response steps on its patient pages.
Clinically, what level of blood sugar is dangerous depends on context. A single 200 mg/dL reading after a large meal may not be urgent, while 300+ mg/dL with ketones can signal impending ketoacidosis. Conversely, 60 mg/dL during sleep can be dangerous, especially if unrecognized. If levels remain very high with nausea or abdominal pain, seek urgent evaluation because diabetic ketoacidosis requires clinical care. The CDC provides practical sick-day information and safety reminders on its sick-day planning page.
Immediate Steps When Levels Spike
Short-term actions can reduce risk while you arrange follow-up. Hydrate with water to support renal glucose clearance. If you are not ketotic, light walking can help muscles use circulating glucose. Recheck in 1–2 hours to confirm change and document patterns. Avoid stacking correction doses unless directed by your clinician.
Knowing how to reduce blood sugar level immediately involves safety checks. If your meter reads above 250 mg/dL more than once, check for ketones when possible. During pregnancy, ketonuria requires prompt attention; for practical background, see Ketones In Urine for definitions and risk context. If vomiting, confusion, or heavy breathing occur, seek urgent care. Record timing, food, activity, illness, and medication to help clinicians assess the trigger.
Longer-Term Control Plan
Day-to-day consistency anchors safe control. Structured monitoring, meal planning, sleep regularity, and medication adherence all matter. If you use a meter, devices with memory and app support can simplify tracking; for Bluetooth logging and reminders, see the Onetouch Verio Flex Meter. Paired with appropriate supplies like Freestyle Lite Test Strips, you can capture reliable data for clinic visits.
Knowing what to do when blood sugar is high also means reviewing longer-term therapy. Some people benefit from dietary adjustments or medication changes. For patients with type 2 diabetes, SGLT2 inhibitors may be considered; for details on one option, review Invokana 100mg 300mg and discuss with your clinician whether this class suits your risks and goals. For broader reading and ongoing updates, browse Diabetes Articles to deepen understanding between appointments.
Type 2 Patterns and Age Considerations
People with type 2 diabetes often show larger post-meal rises due to insulin resistance (reduced insulin effect). Emphasize carbohydrate quality, consistent mealtimes, and activity after eating. If weight changes influence control, consider how insulin and other therapies affect appetite; for background on weight dynamics, see Insulin And Weight Gain for mechanisms and mitigation strategies discussed in plain terms.
Targets may be individualized for older adults to reduce hypoglycemia risk. Eye and cardiovascular screening remain important as disease duration increases. For vision protection strategies and reminders, review Diabetic Eye Disease Month. For heart risk awareness and the glucose–cardio connection, see National Diabetes Heart Connection Day. If lipid control is part of your plan, therapies like Rosuvastatin may be discussed with your clinician to address broader cardiometabolic risk.
Recap
Use targets to frame, not dictate, daily decisions. Combine fasting, post-meal, and A1C data with symptoms and context. Act promptly on worrisome lows or highs, especially with ketones or illness. Keep your care team informed when patterns shift.
For a curated set of how‑to resources and self‑care checklists, explore National Diabetes Education Week Tools again and consider visiting the broader Diabetes Products catalog to identify testing tools that fit your routine.
Medical Disclaimer: This content is for informational purposes only and is not a substitute for professional medical advice.