
A Blood Sugar Chart is a quick reference for interpreting glucose readings by timing, such as fasting, before meals, after meals, or at random. For many adults without diabetes, fasting glucose is commonly 70–99 mg/dL, or 3.9–5.5 mmol/L. For many nonpregnant adults with diabetes, common targets are 80–130 mg/dL before meals and under 180 mg/dL two hours after the start of a meal. These numbers are not a diagnosis by themselves, but they help you spot patterns, prepare questions, and recognize low or very high readings that may need timely care.
Key Takeaways
- A Blood Sugar Chart works best when you match the number to timing.
- Fasting, post-meal, random, and A1C results answer different questions.
- Targets for diabetes are individualized, especially during pregnancy, childhood, frailty, or frequent lows.
- Low readings below 70 mg/dL need attention, and severe symptoms need urgent help.
- One unusual result matters less than repeated patterns or symptoms.
Blood Sugar Chart for Common Situations
Use the Blood Sugar Chart below as an orientation tool, not as a personal treatment plan. A meter reading can be affected by food, medication timing, exercise, stress, illness, sleep, alcohol, hand contamination, and device technique. Laboratory results also use specific testing conditions, so a home meter number may not mean the same thing as a diagnostic lab test.
| Reading situation | Common range or target | How to interpret it |
|---|---|---|
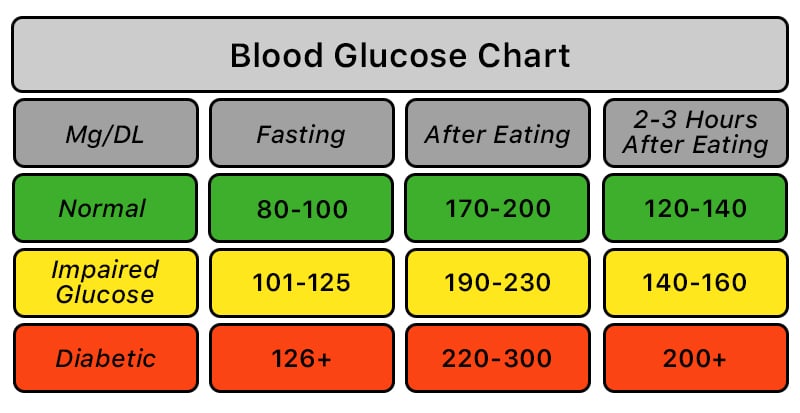
| Fasting, adult without diabetes | 70–99 mg/dL, or 3.9–5.5 mmol/L | This is commonly considered a normal fasting range. A result above this may need repeat lab testing. |
| Fasting diagnostic ranges | 100–125 mg/dL suggests prediabetes; 126 mg/dL or higher is in the diabetes range if confirmed | Diagnosis depends on proper testing, repeat confirmation, symptoms, and clinician review. |
| Before meals, many adults with diabetes | 80–130 mg/dL, or 4.4–7.2 mmol/L | This is a common target range for many nonpregnant adults, but personal goals can differ. |
| Two hours after the start of a meal, many adults with diabetes | Less than 180 mg/dL, or 10.0 mmol/L | This helps show how food, medication, and activity affect post-meal glucose. |
| Two hours after an oral glucose tolerance test | Less than 140 mg/dL is usually normal; 140–199 mg/dL suggests prediabetes; 200 mg/dL or higher is in the diabetes range if confirmed | This lab test uses a defined glucose drink, so it differs from an ordinary meal reading. |
| Random blood sugar | No single normal range fits every situation | A random value of 200 mg/dL or higher with symptoms needs prompt medical evaluation. |
| Low blood sugar alert | Below 70 mg/dL, or 3.9 mmol/L | This is hypoglycemia and should be handled using your personal low-blood-sugar plan. |
| Clinically significant low | Below 54 mg/dL, or 3.0 mmol/L | This level carries higher risk and should not be ignored. |
For a broader discussion of targets, monitoring, and safety language, see the related page on Safe Diabetes Numbers.
Why it matters: The same number can mean different things before breakfast, after lunch, or during illness.
How to Read a Blood Sugar Chart by Timing
Timing is the first detail to check because glucose changes throughout the day. A fasting reading reflects overnight glucose regulation. A pre-meal reading shows where glucose sits before new carbohydrate enters the bloodstream. A post-meal reading shows how the body responds to a meal, medication, and activity.
After eating, blood sugar usually rises and then trends back down. In many people without diabetes, a two-hour value during formal testing is expected to be below 140 mg/dL. In many adults with diabetes, clinicians often use a post-meal target below 180 mg/dL, usually measured one to two hours after the start of a meal. Your care plan may use a different timing rule, so keep the method consistent.
A random blood sugar normal range is harder to define. A reading taken after a snack, during a stressful day, or shortly after exercise may not compare neatly with a fasting lab result. If you track home readings, write down the time, meal, activity, symptoms, and medication timing. That context makes the number more useful.
Food questions often come up when people compare readings. A tuna sandwich, for example, is not automatically good or bad for people with diabetes. The glucose effect depends on the bread, portion size, added sugars, side dishes, activity, and personal response. If post-meal readings repeatedly rise above your target, ask your clinician or registered dietitian how to adjust meal planning safely.
For more on high readings after meals, review Postprandial Hyperglycemia.
When Low or High Numbers Become Safety Signals
Low blood sugar can become urgent quickly, especially for people using insulin or medications that can cause hypoglycemia. Common symptoms include shakiness, sweating, hunger, a fast heartbeat, weakness, headache, blurred vision, irritability, or confusion. Severe hypoglycemia can cause seizures, loss of consciousness, or the need for help from another person.
If your reading is below 70 mg/dL, follow the low-blood-sugar instructions your care team provided. If you feel severely confused, cannot keep food or liquid down, pass out, or have a seizure, emergency care is needed. If your reading seems unlikely, wash and dry your hands, check the strip or sensor instructions, and repeat the test if appropriate. Do not delay urgent care for severe symptoms.
High blood sugar risk depends on the level, duration, symptoms, and diabetes type. A single high reading after a large meal may not be an emergency. Repeated highs, readings above your personal action threshold, or high readings during illness need closer attention. Symptoms of hyperglycemia can include increased thirst, frequent urination, blurry vision, fatigue, and dry mouth.
Very high readings can be more concerning when ketones are present. Ketones are acids the body can produce when it breaks down fat for fuel. In some diabetes sick-day plans, ketone testing is discussed when glucose is around 240 mg/dL, or 13.3 mmol/L, or higher, especially in type 1 diabetes. Seek urgent care for high readings with vomiting, severe dehydration, deep or rapid breathing, fruity-smelling breath, confusion, marked drowsiness, or positive ketones.
To understand the difference between ordinary nutritional ketosis and the dangerous diabetes emergency called ketoacidosis, read Ketosis vs Ketoacidosis.
Age, Sex, and Personal Targets Are Not the Same Thing
There is no single normal blood sugar levels chart by age that applies to every adult. Standard lab reference ranges for fasting glucose are often similar across adulthood. A person aged 50 to 60 does not automatically have a different normal fasting range simply because of age.
Age still matters because treatment goals may change. Older adults with multiple health conditions, a history of severe lows, cognitive changes, or higher fall risk may need less aggressive targets. Younger adults, pregnant people, and children may have different goals and monitoring plans. These decisions belong with a clinician who knows the person’s full medical history.
Female blood sugar levels and hormones
Most standard reference ranges are not separated into male and female charts for nonpregnant adults. However, menstrual cycles, menopause, polycystic ovary syndrome, pregnancy, sleep disruption, and stress can affect insulin sensitivity and day-to-day readings. Pregnancy has its own glucose targets and testing approach. Anyone pregnant, planning pregnancy, or diagnosed with gestational diabetes should follow obstetric and diabetes care guidance rather than a general chart.
Children and teens
Children and teens also need individualized targets. Growth, puberty, school schedules, sports, food intake, and hypoglycemia risk can all affect a diabetes plan. A family should not use an adult chart to change a child’s medication, insulin dose, or carbohydrate targets without professional guidance.
Patterns Matter More Than One Isolated Number
A Blood Sugar Chart cannot show the full picture on its own. Clinicians often look for patterns across several days or weeks. Repeated fasting highs, frequent post-meal spikes, overnight lows, or large swings may be more useful than one reading taken during an unusual day.
A1C is another piece of the picture. It estimates average blood glucose over roughly the past two to three months, but it does not show daily highs and lows. Conditions that affect red blood cells can also affect A1C accuracy. For more background, see A1C Test.
Continuous glucose monitors, or CGMs, can show a 24-hour glucose curve. A normal blood sugar graph is not completely flat. Meals, activity, sleep, stress hormones, illness, and medication timing can all shift the curve. Time in range, overnight patterns, and post-meal trends can help guide care discussions.
Glucose units can also cause confusion. In the United States, meters often show mg/dL. In Canada and many other countries, results often use mmol/L. The converter below helps translate values so you can read a chart, lab result, or device report in the unit you use.
Blood Glucose Unit Converter
Convert glucose readings between mg/dL and mmol/L without changing the clinical value.
These calculations are for education only and do not replace clinical advice, diagnosis, or treatment. Always confirm medical decisions with a qualified healthcare professional.
Use conversion as a reading aid only. It does not decide whether a result is safe for you or replace clinical judgment.
Stress can also raise glucose in some people. If stressful periods seem to match higher readings, the related discussion on Stress and Diabetes may help you prepare better questions for your care team.
Using Your Results in a Care Conversation
The safest use of a chart is to organize information, not to self-adjust treatment. Bring your log, meter download, CGM report, medication list, and symptom notes to appointments. Mention any lows, overnight readings, sick days, missed meals, steroid use, alcohol intake, or changes in exercise.
Helpful details include when the reading was taken, what you ate, whether you were active, and whether symptoms were present. If you use insulin or other glucose-lowering medication, record doses exactly as prescribed. Do not change, stop, or start medication based only on a chart unless your clinician has already given you a written plan for that situation.
If medication options are part of your care discussion, ask how each option affects fasting readings, post-meal readings, hypoglycemia risk, weight, kidney function, heart risk, side effects, and monitoring. For one common treatment backgrounder, see Metformin and Type 2 Diabetes.
Quick tip: Label each reading as fasting, before meal, after meal, bedtime, or overnight.
General standards can help frame the discussion, but personal targets still matter. For a related overview of guideline-based diabetes care topics, visit Diabetes Care Standards. You can also browse the Diabetes Article Hub for more educational topics.
Authoritative Sources
- CDC blood sugar management guidance summarizes common diabetes targets, monitoring basics, and high or low blood sugar safety.
- American Diabetes Association diagnosis information explains diagnostic ranges for A1C, fasting glucose, glucose tolerance, and random glucose.
- MedlinePlus blood glucose information provides plain-language background on blood glucose tests and why they are checked.
This content is for informational purposes only and is not a substitute for professional medical advice.
