
Insulin Receptors: Structure, Function, and Pathway Summary starts with one core idea: the insulin receptor is a cell-surface protein that binds insulin and turns that outside message into intracellular signaling. It acts like a molecular switch. When it responds normally, cells can adjust glucose handling, fuel storage, and gene activity. When signaling is impaired, insulin resistance and abnormal blood sugar can follow.
This matters because the receptor sits near the top of a pathway discussed across the Diabetes Hub. It also helps explain why Insulin Resistance Vs Diabetes is not the same conversation, even though the two are closely linked. Downstream problems often show up as High Blood Sugar Signs, not as a symptom unique to the receptor itself.
Key Takeaways
- The insulin receptor is a preassembled receptor tyrosine kinase.
- It contains two alpha and two beta subunits.
- Insulin binding triggers conformational change and autophosphorylation.
- IRS proteins connect the receptor to PI3K-Akt and MAPK signaling.
- Insulin resistance can involve receptor defects, post-receptor defects, or both.
Insulin Receptor Structure And Function At A Glance
The insulin receptor is a receptor tyrosine kinase, an enzyme-linked surface receptor that adds phosphate groups to tyrosine residues after activation. It is found on many cells, with major metabolic roles in muscle, fat, and liver. Insulin does not move glucose by itself. Instead, it binds the receptor, and the receptor starts a signaling cascade that changes what the cell does next.
That distinction helps with context. In type 1 diabetes, the main issue is too little or no insulin production. In type 2 diabetes, tissues may also respond less effectively to insulin. So the insulin receptor sits at an important junction between the hormone outside the cell and the actions inside the cell. It helps regulate glucose uptake, glycogen formation, lipid metabolism, and many gene-level responses.
Because the receptor launches several different signals at once, its function reaches beyond sugar alone. It also influences cell growth, protein synthesis, and survival pathways. That is why receptor biology appears in discussions of common metabolic disease and in rare inherited disorders involving the INSR gene.
Structure: Alpha Subunits, Beta Subunits, And The Kinase Core
How the receptor is built
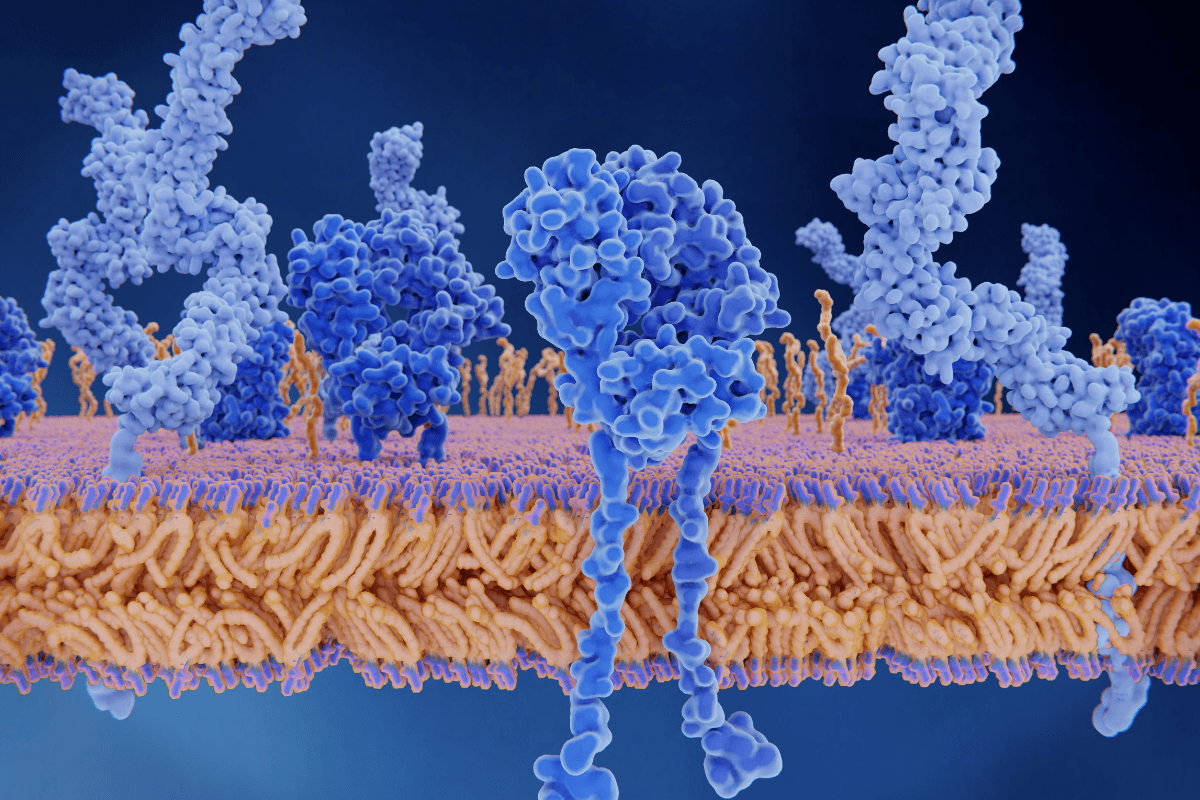
The receptor is a heterotetrameric (four-part) complex made of two alpha subunits and two beta subunits linked by disulfide bonds. The alpha subunits sit outside the cell and contain the main insulin-binding regions. Each beta subunit crosses the membrane and extends into the cell, where it carries the tyrosine kinase domain. In plain language, the outside part senses insulin, and the inside part passes the message along.
One useful detail often missed in simple diagrams is that the insulin receptor is already assembled before insulin arrives. Many other receptor tyrosine kinases become active by pairing up after ligand binding. The insulin receptor is different. Insulin mainly changes the shape and internal arrangement of a receptor that is already joined together. That makes the question less about dimer formation and more about conformational change, or shape change, after binding.
Why the layout matters
The layout explains the usual textbook labels. The extracellular alpha region is where insulin docks. The transmembrane segment anchors the receptor in the cell membrane. The intracellular beta region contains the kinase domain, which becomes activated and starts phosphorylation events. The INSR gene encodes this receptor, and changes in that gene can lead to rare but important defects in insulin action.
The insulin receptor also belongs to the same family as the IGF-1 receptor. They share a similar overall design, but their dominant roles differ. The insulin receptor is best known for acute metabolic control, while the IGF-1 receptor is more strongly associated with growth signaling. That overlap helps explain why pathway diagrams can look similar even when the biological emphasis is different.
How Insulin Binding Activates The Receptor
Activation begins when insulin binds the extracellular portion of the receptor. That binding stabilizes a new receptor shape and allows the intracellular kinase regions to become more active. The early biochemical step is autophosphorylation (the receptor adding phosphate groups to itself). Those phosphate groups create docking sites for signaling proteins that relay the message deeper into the cell.
Why it matters: A weak signal at this first step can blunt many downstream metabolic effects.
One major group of docking proteins is the insulin receptor substrate family, often shortened to IRS proteins. Once the receptor phosphorylates these adaptor proteins, they recruit enzymes and scaffolds that split the message into several branches. This is the heart of insulin receptor signal transduction. A single binding event at the membrane becomes a coordinated program that can alter transporter movement, enzyme activity, and gene expression.
The signal does not stay on forever. After activation, the receptor can be internalized through endocytosis (cell uptake of surface material). Some receptors are recycled back to the membrane. Others are degraded. This turnover helps control signal intensity and duration. It also explains why receptor number at the cell surface can change over time.
The Main Arms Of The Insulin Signaling Pathway
After IRS proteins are engaged, the best-known metabolic branch is the PI3K-Akt pathway. PI3K helps generate membrane signals that activate Akt, sometimes called protein kinase B. In muscle and adipose tissue, this branch supports GLUT4 translocation, which means GLUT4 glucose transporters move to the cell surface and allow more glucose entry. In the liver, the same broad signaling network helps suppress glucose production and promotes storage pathways such as glycogen synthesis.
A second major branch leads toward MAPK signaling. This arm is more closely tied to cell growth, proliferation, differentiation, and gene regulation. It matters because insulin is not only a glucose hormone. It is also an anabolic hormone, meaning it supports building and storage processes. So a complete pathway summary needs both the metabolic arm and the growth-signaling arm, even though many consumer explanations focus only on glucose uptake.
| Pathway arm | Key intermediates | Typical effects | Why it matters |
|---|---|---|---|
| PI3K-Akt | IRS, PI3K, Akt | GLUT4 movement, glycogen synthesis, metabolic regulation | Explains much of insulin’s day-to-day control of glucose |
| MAPK | Adaptor proteins, Ras, MAPK cascade | Growth signals, gene expression, cell response changes | Shows that receptor signaling is broader than sugar handling |
Not every tissue uses the pathway in exactly the same way. Muscle and fat are central for GLUT4-mediated uptake. Liver signaling shifts metabolism through a somewhat different output pattern. That is one reason a simplified insulin signaling pathway diagram can be helpful, but it never captures every tissue-specific detail.
What Changes In Insulin Resistance And Receptor Defects
Most people do not feel an insulin receptor problem directly. They feel the consequences of weak insulin action, such as rising glucose levels. In everyday clinical discussion, that often shows up as signs covered in High Blood Sugar Signs. By contrast, episodes such as Reactive Hypoglycemia usually reflect a different pattern and should not be assumed to mean a receptor defect.
Receptor problems are only part of the story
True receptor defects do exist. Rare INSR gene variants can cause severe insulin resistance syndromes. In those cases, the problem may involve impaired insulin binding, reduced receptor processing, or poor kinase activity. But in common type 2 diabetes and obesity-related insulin resistance, the issue is often not a missing receptor alone. Post-receptor signaling defects matter too. IRS proteins may be modified in ways that weaken signaling. Inflammation, lipid overload, and chronic metabolic stress can also interfere with normal pathway flow.
That distinction matters because insulin resistance is not a single broken switch. It is usually a network problem. Receptor number, receptor activation, intracellular signaling quality, transporter movement, and tissue context can all influence the final response. This broader view helps when reading comparisons like Insulin Resistance Vs Diabetes, where altered signaling is part of the story but not the whole story.
Researchers also distinguish between reduced receptor signaling and reduced insulin availability. The receptor can be structurally normal, but the message reaching it may still be inadequate if insulin production falls. That is another reason receptor biology should be understood as one layer of diabetes physiology, not the entire picture.
How To Read An Insulin Receptor Diagram
If you are trying to understand an insulin receptor diagram or memorize the insulin signaling pathway steps, look for sequence before detail. First find insulin outside the cell. Next find the alpha and beta receptor subunits. Then trace autophosphorylation, IRS recruitment, PI3K-Akt signaling, and finally the cellular effect, such as GLUT4 movement or metabolic enzyme changes. That order prevents the pathway from feeling like a list of disconnected abbreviations.
Quick tip: Follow the signal from membrane to outcome, not from acronym to acronym.
A compact way to remember the pathway is:
- Insulin binds outside.
- Receptor shape shifts.
- Beta subunits autophosphorylate.
- IRS proteins dock.
- PI3K-Akt and MAPK branch.
- Metabolic and gene effects follow.
When a diagram adds receptor endocytosis, treat that as the control phase. It helps explain why cells can tune the strength and duration of the message. When a diagram adds IGF-1 receptor overlap or hybrid receptors, treat that as advanced context rather than the first fact to memorize.
Where This Biology Fits In Diabetes Treatment
Insulin receptor biology helps explain why diabetes medicines do not all work the same way. Some therapies improve insulin sensitivity or support insulin action indirectly. Others lower glucose without directly targeting the receptor itself. That is why a pathway summary is useful, but it is not the same as a treatment algorithm.
For example, Metformin is commonly discussed as an insulin-sensitizing medication, though its major effects include changes in hepatic glucose production. A thiazolidinedione example is outlined in How Avandia Works, where the emphasis is on improving sensitivity through gene-regulation pathways rather than simply flipping the receptor on. By contrast, Farxiga lowers glucose mainly through the kidney. Alpha-Glucosidase Inhibitors work in the gut by slowing carbohydrate absorption.
That broader view keeps receptor biology in proportion. It is foundational, but it is only one part of diabetes care. If you want to compare more classes and condition resources, you can browse Diabetes Medications and the Diabetes Articles archive for related topics.
On this site, prescription details may need confirmation with the prescriber.
This is also why reading biology and treatment pages side by side can help. A receptor pathway explains how the signal should travel. A therapy page explains where a medication acts, where it does not act, and what kind of clinical question it is trying to address. Used together, those perspectives make the bigger picture easier to follow.
For broader condition context, the Diabetes Hub collects related pages on symptoms, treatment classes, and complications. That is often a better next step than trying to memorize every signaling protein in a single sitting.
Authoritative Sources
- For receptor biology and signal transduction, see the NCBI Bookshelf review of the insulin receptor network.
- For the gene behind the receptor, see MedlinePlus Genetics on the INSR gene.
- For a classic review of structure and signaling, read the PubMed summary of insulin receptor structure and function.
Where permitted, licensed third-party pharmacies handle dispensing and fulfilment.
The short version is that the insulin receptor is a preassembled membrane receptor that binds insulin, changes shape, autophosphorylates, recruits IRS proteins, and branches into PI3K-Akt and MAPK signaling. That sequence explains how a hormone outside the cell changes metabolism inside it, and why disrupted signaling matters in insulin resistance and diabetes.
This content is for informational purposes only and is not a substitute for professional medical advice.
