
Understanding your numbers turns data into action. A Blood Sugar Chart helps you translate test results into everyday decisions. This guide explains targets, dangerous levels, and monitoring methods in clear, practical terms. We combine clinical thresholds with plain-language tips so you can discuss personalized goals with your care team.
Key Takeaways
- Know your targets: fasting, premeal, and postmeal ranges.
- Watch for danger signs of high or low glucose.
- Use the right monitoring tools for your routine.
- Adjust goals for age, comorbidities, and medications.
Blood Sugar Chart
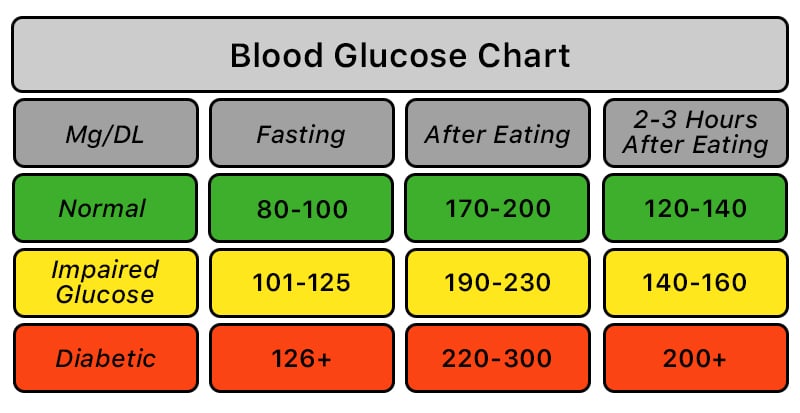
Glucose targets vary with diabetes status, age, and health goals. The table below summarizes commonly used ranges in milligrams per deciliter (mg/dL). These are population guidelines; your clinician may individualize them to reduce hypoglycemia risk or match therapy intensity.
| Context | Without Diabetes | With Diabetes |
|---|---|---|
| Fasting (8 hours) | 70–99 | 80–130 |
| Before meals | 70–99 | 80–130 |
| 2 hours after meals | < 140 | < 180 |
| Bedtime | 90–120 | 90–150 (individualized) |
These thresholds align with major diabetes guidelines for nonpregnant adults and typical home monitoring. Targets can shift with pregnancy, chronic kidney disease, frailty, or hypoglycemia unawareness. Discuss any persistent deviations and confirm outlier readings with a lab test when appropriate.
For detailed clinical targets and diagnostic cut points, the American Diabetes Association provides annual Standards of Care; review the current guidance for context and definitions (ADA Standards of Care).
Understanding Normal Ranges and Targets
Clinicians use ranges to guide treatment and safety. Many adults without diabetes aim for a sugar level normal range near 70–99 mg/dL before meals, and below 140 mg/dL two hours after eating. People with diabetes often target 80–130 mg/dL before meals and under 180 mg/dL postmeal. These limits help balance daily function with long-term risk reduction.
Hemoglobin A1c (A1C) complements daily checks by reflecting average glucose across about three months. Pair home testing with lab A1C to capture both patterns and trends. If you are unsure how often to measure at home, see Monitor Blood Sugar Frequency for a practical schedule and decision points.
Age and Sex Differences in Glycemia
Targets often broaden with age to reduce hypoglycemia risk and treatment burden. For example, older adults with multiple conditions may safely use slightly higher premeal or bedtime targets. That is why a normal blood sugar levels chart by age can be helpful as an orientation tool, not a strict rulebook. Individualized plans matter more than a single universal threshold.
Sex-related differences are usually modest and influenced by body composition, hormones, and medication response. Women may see fluctuations around menstrual cycles or during menopause, while men can experience shifts with changes in visceral fat and activity. Always consider your personal baseline, recent illnesses, and therapy when interpreting day-to-day variability.
Age Bands 40–70: What Shifts and Why
Between ages 40 and 70, insulin sensitivity can decline gradually, particularly with reduced muscle mass and increased visceral fat. Some adults tighten activity and dietary patterns to counter this trend, while others need therapy adjustments. Clinicians may ease bedtime targets for individuals at higher risk of nocturnal lows. If you are evaluating ranges for the 50s or 60s, prioritize safety, independence, and comorbidity management over perfect numerical symmetry. The right range is the one that maximizes daily function while minimizing acute events.
Post-Meal and Overnight Targets
Postmeal spikes drive a significant portion of average glucose exposure. A common reference is normal blood sugar 2 hours after eating below 140 mg/dL without diabetes, or under 180 mg/dL for many people with diabetes. Measuring at the two-hour mark gives a consistent comparison point. Pair this with occasional premeal checks to see the full postprandial curve and identify high-glycemic triggers.
Overnight patterns reveal risk for unrecognized lows or sustained highs. If you wake with headaches, fatigue, or unusually high morning readings, consider a bedtime snack review, medication timing, or nocturnal checks. A short series of 3 a.m. measurements or sensor data can uncover hidden variability and inform safer adjustments.
Tip: If a single postmeal value seems out of pattern, confirm on another day before making changes. Look for repeatable trends.
Random and Opportunistic Testing
Clinicians sometimes use random checks to capture everyday fluctuations outside scheduled testing. A random blood sugar normal range generally mirrors nonfasting expectations: values near or below the mid-100s without diabetes, and individualized targets with diabetes. Persistent readings far above target, especially with symptoms, deserve prompt clinical review.
For diagnosis, a random plasma glucose of 200 mg/dL or higher with classic hyperglycemia symptoms suggests diabetes and merits confirmatory testing in most cases. Random checks can also uncover hypoglycemia patterns during unexpected activity or delayed meals. If random testing raises concerns, document timing, meals, and symptoms so your care team can contextualize the numbers.
Monitoring Technologies and Methods
Today’s tools range from fingerstick meters to continuous glucose monitoring devices. Meters provide point-in-time values and remain essential for calibration, safety checks, and confirmation of outlier sensor readings. Sensors add trend arrows and overnight visibility, which can reduce uncertainty and help tailor therapy and meals.
Pick tools that fit your routine. Some people prefer needle-free options like patches or smartwatches; others want app-based logging and reminders. Accuracy, alarms, and cost all matter. The U.S. Food and Drug Administration publishes device information and patient considerations; review current device overviews for capabilities and limitations (FDA on CGM systems).
When Levels Are Dangerous
Recognizing danger thresholds prevents emergencies. A practical question is what level of blood sugar is dangerous. Generally, sustained values above 240–250 mg/dL, especially with ketones or illness, raise concern for diabetic ketoacidosis in those at risk. On the other end, levels at or below 70 mg/dL indicate hypoglycemia, and 54 mg/dL or lower signals clinically significant hypoglycemia.
Symptoms guide urgency: severe thirst, frequent urination, vomiting, or deep fatigue with high readings suggest immediate evaluation. Confusion, seizure, or loss of consciousness with low readings signals a medical emergency. For threshold definitions and symptom lists, review this overview from a national public health source (CDC hypoglycemia guidance).
Immediate Actions for High or Low Glucose
When readings exceed targets, many ask how to reduce blood sugar level immediately. If you feel well and have no ketone risk, light hydration and a brief walk may help lower mild elevations. Re-check in 30–60 minutes to confirm improvement. If you use insulin or other glucose-lowering medications, follow your clinician’s written plan for corrections and sick days.
For hypoglycemia, use fast carbohydrates such as glucose tablets, juice, or regular soda. A common approach is about 15 grams of fast carbs, then recheck after 15 minutes, repeating as needed until safely above target. Avoid overtreating to prevent rebounds. If severe symptoms occur or if you cannot swallow safely, seek urgent care. For broader principles that explain high readings and symptoms, see the concise Sugar High Overview for context and examples.
Practical Steps To Improve Control
Start with consistent routines. Build a regular meal pattern with balanced carbohydrates, fiber, and protein. Pair this with activity most days of the week, tailored to your mobility and preferences. Small, repeatable habits often stabilize daily variability more than infrequent, intense efforts. Review labels and portion sizes to reduce hidden sugars and refined starches.
Meal planning can make targets easier to hit. For structure and ingredient ideas, see our Diabetes-Friendly Diet Plan for practical swaps and plate balance. If you use supplemental nutrition, the Glucerna product pages explain macronutrient profiles and common use cases so you can compare options. For convenient protein choices, Protein Shakes for Diabetics reviews formulations and timing considerations.
Prevention still matters if your numbers sit near threshold. Early lifestyle changes can delay progression and complications. To recognize early warning signs and get screening prompts, read Prediabetes Symptoms for symptom patterns and prevention strategies.
Related Therapies and Care
Medication plans should align with your charted patterns. If you and your clinician are calibrating doses, the Insulin Dosage Chart outlines calculation approaches and safety checkpoints. When mixing basal and bolus insulins, the Premixed Insulin Guide explains who might benefit and what to monitor.
Some regimens emphasize basal coverage. If you are reviewing long-acting options, see Lantus Vial for product specifics, and compare with your provider’s recommendations. For combination oral therapies that affect fasting and postmeal control, Invokamet pages outline ingredients and indications to support informed discussions during appointments.
Recap
Use your chart to translate readings into patterns and actions. Confirm true trends with repeat checks, and prioritize safety when values drift far from targets. Choose monitoring tools that match your routines, and revisit goals as health circumstances change.
For broader context across nutrition, monitoring, and therapies, browse Diabetes Articles to connect this guide with related topics and how-tos.
Note: Targets and actions vary by person, medications, and comorbidities. Use this guide to prepare for conversations with your care team.
This content is for informational purposes only and is not a substitute for professional medical advice.

